
Product Development Cost Estimation Guide 2026

Overview: Product development cost estimation involves forecasting expenses across design, prototyping, and manufacturing phases using methods like bottom-up, parametric, and analogous estimation. Accurate estimates require calculating direct costs (materials, labor), indirect costs (overhead, utilities), and contingency buffers of 5-15%. Modern estimation relies on phase-based resource allocation rather than granular task-level predictions, with design and prototyping typically representing the bulk of development expenses.
Cost estimates shape everything about how products get built. Set the number too low, and teams run out of budget mid-project. Too high, and stakeholders kill promising ideas before they start.
The challenge? Product development spans multiple phases—each with different cost drivers, uncertainty levels, and calculation methods. Hardware products need prototype iterations. Software projects require developer hours. Manufacturing involves materials, tooling, and overhead.
Creating accurate estimates isn't about predicting the future perfectly. It's about building a framework that accounts for knowns, unknowns, and the inevitable surprises that emerge during development.
What is Product Development Cost Estimation?
Product development cost estimation is the process of forecasting total expenses required to deliver a defined scope of work, from initial concept through production-ready output. The estimate forms the foundation for budget allocation, resource planning, and go/no-go decisions.
A full hardware product development cycle spans ideation, research, concept development, design, prototyping, manufacturing, and marketing. But here's the thing—the bulk of product development cost typically arises during the design and prototyping phases.
For software and digital products, development and quality assurance consume the largest portions of budgets. Manufacturing products add material costs, tooling expenses, and production overhead into the equation.
Why Cost Estimation Matters
Accurate cost estimates do more than prevent budget overruns. They set realistic financial expectations from the outset, enabling better strategic decisions about which projects to pursue.
Without solid estimates, teams can't evaluate profitability, prioritize features effectively, or allocate resources efficiently. Management reserve and contingency planning become guesswork rather than calculated risk mitigation.
The numbers guide pricing strategies too. Understanding true development costs directly influences selling price calculations and margin protection.
Core Cost Components in Product Development
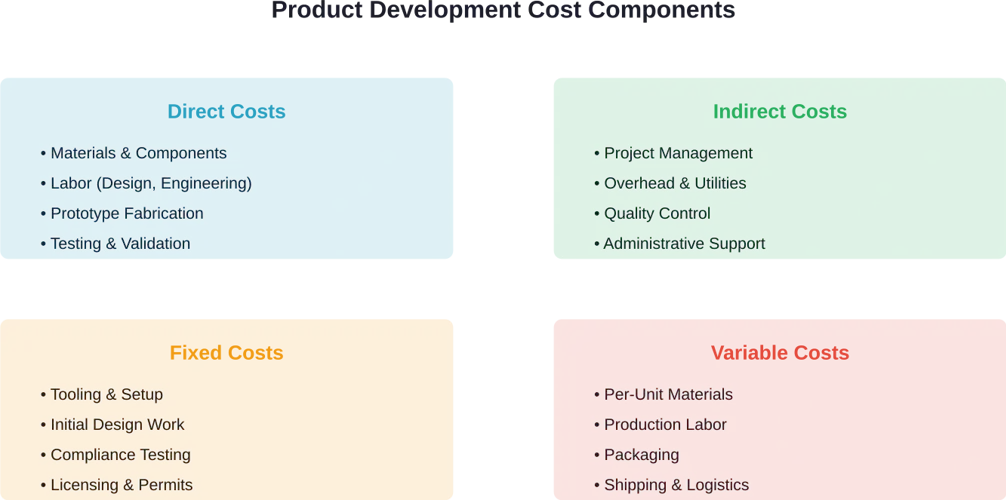
Breaking down product development into cost categories reveals where money actually goes. Different project types emphasize different components, but most estimates need to account for both direct and indirect expenses.
Direct Costs
Direct costs tie directly to creating the product itself. For hardware development, this includes materials for prototypes and production runs. Labor represents the largest direct cost for most projects—designers, engineers, developers, and specialists working on the product.
In manufacturing contexts, direct materials might run $50,000 while labor costs (direct plus indirect) add another $30,000 to the total. These numbers scale based on product complexity and team composition.
Design firms charge specific rates for their direct services. Even when clients have ideas for specific products, industrial designers still need to review the product idea, conduct user research focused on ergonomics and usability, and develop initial sketch concepts.
Indirect Costs
Indirect costs support development without appearing directly in the final product. Manufacturing overhead of $20,000 might cover quality control, supervision, factory utilities, and insurance.
Project management time, administrative support, software licenses, and facility expenses all fall into indirect categories. These often get overlooked in early estimates, creating budget gaps later.
Companies must regularly review indirect costs to keep overall manufacturing cost estimates accurate and prevent profit leaks. The challenge is that indirect expenses don't scale linearly with project size.
Fixed vs. Variable Costs
Fixed costs remain constant regardless of production volume—tooling setup, initial design work, and regulatory compliance testing. Variable costs change with quantity—materials, per-unit labor, and packaging.
This distinction matters enormously for cost estimation. A prototype might cost $40,000 to produce one unit, but per-unit costs drop dramatically at scale when fixed expenses spread across thousands of products.
Cost Estimation Methods for Product Development
Different estimation methods suit different project stages and information availability. Early concepts need approaches that work with limited data. Detailed design phases can leverage granular techniques.
Bottom-Up Estimation
Bottom-up estimation builds totals from detailed component-level calculations. Teams break the project into individual tasks, estimate each one separately, then aggregate everything upward.
This method delivers high accuracy when task definitions are clear. A software project might estimate specific hours for each role: project manager at 40 hours, designer at 80 hours, developer at 140 hours, and QA at 40 hours. Multiply by hourly rates—project manager at $60/hour, designer at $55/hour, developer at $70/hour, QA at $45/hour—and the calculation becomes straightforward.
The downside? Bottom-up estimation requires extensive upfront planning. For early-stage products with undefined requirements, this level of detail doesn't exist yet.
Top-Down (Analogous) Estimation
Top-down estimation uses historical data from similar projects to forecast costs. If the last product development cycle cost $120,000 and took six months, a comparable project might land in the same range with adjustments for scope differences.
This approach works well for initial ballpark estimates when detailed specifications aren't finalized. The accuracy depends entirely on how comparable the reference projects actually are.
Organizations with mature project portfolios gain significant advantages here. Teams without historical data need to rely on industry benchmarks or expert judgment instead.
Parametric Estimation
Parametric estimation applies statistical models and unit costs to project parameters. Cost per square foot in construction, cost per function point in software, or cost per feature in product design.
The method scales well and provides consistency across estimates. Once parameters are established, calculating costs for projects of different sizes becomes formulaic.
Accuracy requires good data about the cost relationships. Parameters that work for one product category might not transfer to another.
Three-Point Estimation
Three-point estimation acknowledges uncertainty by calculating optimistic, most likely, and pessimistic scenarios. The weighted average of these three values produces a more realistic estimate than single-point predictions.
This method helps quantify risk and build appropriate contingency reserves. Real talk: most projects don't hit the optimistic case, so weighting toward realistic and pessimistic scenarios improves accuracy.
Phase-Based Resource Allocation
Estimating hours at the individual task level is often too granular and restrictive—especially early in the planning process. Phase-based approaches recommend estimating by phase or role, such as allocating 10% of a team member's time over a month, rather than attempting to predict exact hours for each task.
This flexibility accommodates the reality that detailed requirements emerge during development. It's easier to estimate "two designers at 50% capacity for three months" than to break down every wireframe and iteration upfront.
|
Estimation Method |
Best Use Case |
Accuracy Level |
Data Requirements |
|---|---|---|---|
|
Bottom-Up |
Detailed planning with clear tasks |
High |
Extensive task breakdown |
|
Top-Down |
Early estimates, similar projects |
Medium |
Historical project data |
|
Parametric |
Repeatable projects, scaling |
Medium-High |
Statistical models, unit costs |
|
Three-Point |
Uncertain projects, risk planning |
Medium |
Expert judgment, scenarios |
|
Phase-Based |
Agile, evolving requirements |
Medium |
Role availability, timeline |
Design Phase Cost Estimation
Design work transforms concepts into detailed specifications ready for prototyping. This phase includes user research, ergonomic analysis, concept sketches, CAD modeling, and design refinement.
Industrial design costs vary based on product complexity and iteration cycles. Simple products with minimal user interaction need less research and fewer revision rounds than complex medical devices or consumer electronics.
Design budgets need to account for discovery work that happens before formal design begins. Understanding what clients truly want and how products should function requires dedicated research time that delivers value but doesn't produce visible outputs immediately.
Typical Design Deliverables and Costs
Design phases produce specific deliverables: user research reports, concept sketches, 3D CAD models, technical drawings, and material specifications. Each deliverable represents labor hours at designer rates.
Senior industrial designers command higher rates than junior designers, but they work faster and make fewer costly mistakes. Balancing team composition affects both total costs and timeline.
Design iteration cycles are hard to predict precisely. Most projects need multiple rounds of refinement as stakeholders provide feedback and requirements evolve. Building iteration buffers into estimates prevents budget surprises.
Prototyping Cost Estimation
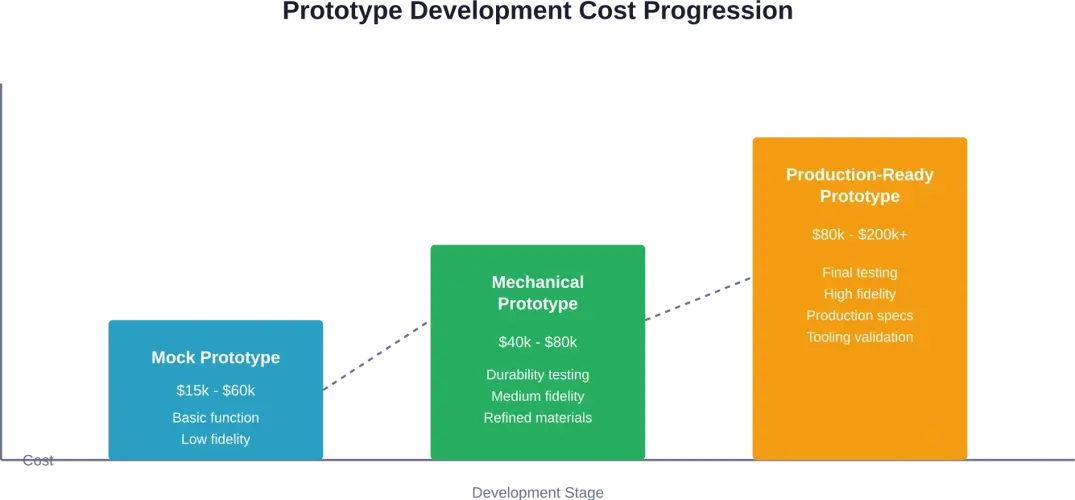
Prototyping costs depend heavily on fidelity level and testing objectives. Low-fidelity mock prototypes serve different purposes than high-fidelity mechanical prototypes, and their cost structures differ accordingly.
Mock prototypes validate basic function and form at relatively low cost, typically ranging from $15,000 to $60,000. These rough prototypes use simpler materials and processes to test core concepts before investing in refined versions.
Mechanical prototypes focus on durability and interaction, requiring more precise manufacturing and materials closer to final production specifications. Costs for mechanical prototypes typically range from $40,000 to $80,000 based on complexity and testing requirements.
Factors That Drive Prototype Costs Higher
Complexity multiplies prototype expenses quickly. Products with electronic components, custom tooling requirements, or specialized materials cost significantly more than simple mechanical designs.
Iteration count matters enormously. Each design change and rebuild adds fabrication costs, material expenses, and labor time. Minimizing iterations through thorough upfront design work pays dividends in prototype budgets.
Manufacturing process selection impacts costs too. 3D printing offers fast turnaround for low quantities but higher per-unit costs. CNC machining delivers better tolerances but requires more setup time. Injection molding needs expensive tooling that only makes sense at production volumes.
Manufacturing Cost Estimation
Manufacturing cost estimation shifts focus from development to production-scale economics. The calculation includes direct materials, labor, and manufacturing overhead.
To calculate total manufacturing cost, use this straightforward formula: direct materials plus labor costs (direct plus indirect) plus manufacturing overhead. For example, $50,000 in direct materials, $30,000 in labor, and $20,000 in overhead yields a total manufacturing cost of $100,000.
But wait—per-unit costs tell a more useful story for production planning. Dividing total manufacturing costs by production quantity reveals the cost per unit, which directly informs pricing strategies and margin calculations.
Material Cost Estimation
Material costs depend on quantities, supplier pricing, and market conditions. Raw material prices fluctuate, especially for commodities like metals and plastics. Building material cost contingencies protects against price volatility.
Volume discounts create economies of scale. Ordering 10,000 units of a component costs dramatically less per unit than ordering 100. This creates tension between minimizing inventory and optimizing unit costs.
Waste rates affect material budgets too. Manufacturing processes rarely achieve 100% yield, so estimates need to account for scrap, defects, and trimming losses.
Labor Cost Calculation
Manufacturing labor includes direct workers assembling products plus indirect support staff. Direct labor hours multiply by wage rates, but don't forget payroll taxes, benefits, and training costs that add 25-40% on top of base wages.
Labor efficiency improves with production volume as workers gain experience and processes optimize. Early production runs take longer per unit than mature manufacturing lines, affecting cost estimates for new products.
Manufacturing Overhead
Manufacturing overhead covers quality control, supervision, factory utilities, and insurance. These indirect costs often represent 30-50% of total manufacturing expenses but receive less estimation attention than materials and direct labor.
Overhead allocation methods vary. Some companies use direct labor hours as the allocation base, others use machine hours or floor space. The method matters less than consistency and regular review to keep estimates accurate.
![]()
Plan Your Product Development Budget With Clarity
If you are planning a digital product, clear budgeting is critical from day one. OSKI Solutions supports product development from discovery to engineering and testing. The team structures the roadmap, defines milestones, and estimates costs per phase. This helps you understand total investment before committing resources.
Ready to Structure Your Product Budget?
Talk with OSKI Solutions to:
- define product milestones and priorities
- estimate costs for each development stage
- align scope with available resources
👉 Get a product development cost estimate from OSKI Solutions.
Turn Your Idea into a Market-Ready Product
We guide you through strategy, design, development, and launch to create scalable digital products that deliver real results.
Building Contingency Reserves
No estimate predicts costs perfectly. Contingency reserves buffer against estimation errors, scope changes, and unforeseen complications.
Management reserve covers unknowns and is typically controlled at a leadership level. There's no fixed percentage that works for every project, but many teams add 5 to 15 percent as contingency depending on how uncertain the project is.
Lower-risk projects with clear requirements and stable technology might justify 5% reserves. High-risk innovation projects with unproven concepts should budget 15% or more.
Contingency vs. Management Reserve
Contingency reserves address known risks—identifiable scenarios that might increase costs. If a supplier might raise prices, or a prototype might need extra iterations, that's contingency territory.
Management reserve handles unknown unknowns—the surprises that emerge unexpectedly. Regulatory requirements that appear mid-project, key personnel leaving, or unexpected technical obstacles.
Tracking these separately provides visibility into risk consumption and helps teams understand whether cost variances stem from poor estimation or genuinely unpredictable events.
Software and Tools for Cost Estimation
Modern cost estimation increasingly relies on specialized software rather than spreadsheets. Resource management platforms integrate estimation with scheduling, time tracking, and budget monitoring.
These tools enable real-time cost tracking against estimates, revealing variances as they occur rather than discovering overruns when it's too late to correct them. The visibility helps project managers make informed decisions about scope, timeline, or resource adjustments.
Feature sets vary widely across platforms. Some focus on labor hour tracking and rate management, others incorporate material costs and vendor pricing. Check the official documentation for current feature availability before committing to specific tools.
Choosing Estimation Software
The right estimation software depends on project types, team size, and integration needs. Teams working on manufacturing projects need different capabilities than software development shops.
Integration with existing project management, accounting, and ERP systems reduces duplicate data entry and keeps information synchronized. Standalone tools require manual updates that create opportunities for errors and inconsistencies.
Pricing varies—check vendor websites for current pricing rather than relying on outdated information. Most platforms offer tiered plans based on team size and feature requirements.
Step-by-Step Cost Estimation Process
Creating estimates systematically improves consistency and accuracy across projects. Here's a practical framework that works for most product development scenarios.
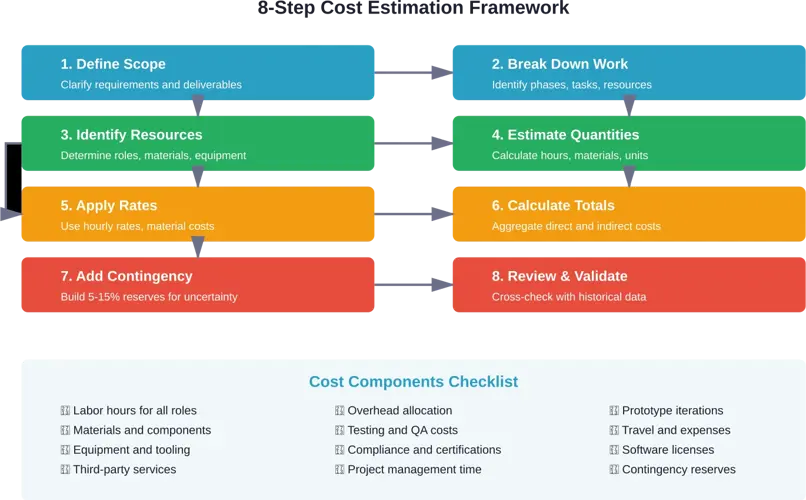
Step 1: Define Scope Clearly
Scope definition establishes what's included and explicitly what's excluded from the estimate. Vague requirements produce inaccurate estimates because different people interpret them differently.
Document specific deliverables, performance requirements, and constraints. If the project includes three prototype iterations, state that explicitly. If regulatory compliance testing is separate, clarify that boundary.
Step 2: Break Down the Work
Work breakdown structures organize projects into manageable components. For product development, common top-level phases include research, design, prototyping, testing, and manufacturing preparation.
The breakdown level depends on estimation method. Phase-based approaches stop at major stages, while bottom-up methods decompose to individual tasks.
Step 3: Identify Required Resources
List every resource type needed—roles, materials, equipment, software, facilities, and external services. Missing resource categories creates estimation gaps that surface as budget overruns later.
Consider both direct and indirect resources. Direct labor might include designers and engineers, but indirect resources like project managers and administrative support still consume budget.
Step 4: Estimate Quantities
Quantify each resource requirement. How many designer hours? How much material? How many prototype iterations?
Use historical data when available, expert judgment when not. Three-point estimation helps bound uncertainty for difficult-to-predict quantities.
Step 5: Apply Cost Rates
Multiply quantities by unit costs—hourly rates for labor, per-unit costs for materials, rental rates for equipment. Current market rates matter more than historical rates if costs have shifted.
Account for rate variations across team members. Senior engineers cost more per hour than junior engineers, but their productivity differences might offset rate differences.
Step 6: Calculate Totals
Aggregate all cost components into direct costs, indirect costs, and overhead. The sum represents the base estimate before contingency.
Organize calculations transparently so reviewers can understand how numbers were derived and where adjustments might be needed.
Step 7: Add Contingency Reserves
Apply appropriate contingency percentages based on project risk and uncertainty. Document the rationale for contingency levels so stakeholders understand why reserves exist.
Separate contingency from management reserve to track different risk categories independently.
Step 8: Review and Validate
Cross-check estimates against historical project data and industry benchmarks. Large variances warrant investigation—either the current project differs significantly or the estimate needs adjustment.
Peer review catches errors and unrealistic assumptions before estimates get locked into budgets and commitments.
Common Cost Estimation Mistakes
Even experienced teams fall into predictable estimation traps. Recognizing these patterns helps avoid repeating them.
Underestimating Indirect Costs
Teams naturally focus on visible direct costs—materials and labor—while underestimating overhead, project management, and support functions. This systematic bias produces estimates that look reasonable but miss 20-30% of actual costs.
Solution? Use historical overhead rates from completed projects rather than guessing. If past projects averaged 35% overhead, use that baseline.
Ignoring Iteration Costs
Initial plans assume everything works perfectly the first time. Reality involves design iterations, prototype rebuilds, and testing failures that require rework.
Building iteration allowances into estimates from the start prevents the "we're 90% done but need another 50% budget" syndrome that plagues development projects.
Optimism Bias
Human psychology skews toward optimistic scenarios. Teams estimate based on best-case timelines and assume no complications, producing estimates that reflect hopes rather than realistic expectations.
Three-point estimation and explicit pessimistic scenarios counteract optimism bias by forcing consideration of what might go wrong.
Scope Creep Blindness
Estimates assume fixed scope, but requirements evolve during development. Small feature additions accumulate into major scope changes that explode budgets.
Formal change control processes with cost impact analysis help stakeholders understand the budget implications of scope adjustments before approving them.
Strategies to Reduce Product Development Costs
Cost estimation reveals where money goes. Cost reduction strategies act on those insights to deliver products more efficiently without sacrificing quality.
Optimize Design for Manufacturability
Design decisions made early in development dramatically impact manufacturing costs downstream. Complex geometries, tight tolerances, and exotic materials drive costs up.
Design for manufacturability principles simplify products to use standard processes and readily available materials. The upfront design effort pays back in lower per-unit costs at scale.
Reduce Prototype Iterations
Every prototype cycle adds cost. Thorough design reviews, simulation, and analysis before building physical prototypes reduce the need for multiple iterations.
Digital prototyping through CAD and finite element analysis catches issues that would otherwise require physical testing and rebuilds.
Negotiate Volume Discounts
Material and component suppliers offer lower per-unit pricing at higher volumes. Consolidating purchases and committing to larger orders reduces material costs significantly.
The tradeoff involves inventory carrying costs and demand uncertainty. Balance volume discounts against the risk of obsolete inventory if designs change.
Leverage Standard Components
Custom parts require tooling, minimum order quantities, and longer lead times. Standard off-the-shelf components cost less and arrive faster.
Design products around available standard components rather than creating custom solutions for everything. Reserve custom fabrication for truly unique requirements where no standard alternative exists.
Linking Costs to Pricing Strategies
Cost estimates feed directly into pricing decisions. Understanding true development and manufacturing costs enables informed decisions about selling price, margins, and profitability.
Cost-plus pricing adds a markup percentage to total costs to determine selling price. If total manufacturing cost per unit is $50 and the target margin is 40%, the selling price becomes $70 per unit.
Value-based pricing uses customer willingness to pay rather than costs as the primary input. But even with value-based pricing, understanding costs establishes the floor below which products lose money.
Break-Even Analysis
Break-even calculations reveal how many units must sell to recover fixed development costs. If development costs $200,000 and profit per unit is $20, break-even occurs at 10,000 units.
This analysis informs decisions about whether to proceed with development. Products with high fixed costs and low unit margins need large sales volumes to become profitable.
|
Cost Element |
Example Amount |
Cost Type |
Impact on Pricing |
|---|---|---|---|
|
Design & Engineering |
$120,000 |
Fixed |
Amortized over volume |
|
Prototype Development |
$60,000 |
Fixed |
Amortized over volume |
|
Materials per Unit |
$15 |
Variable |
Direct cost per unit |
|
Labor per Unit |
$8 |
Variable |
Direct cost per unit |
|
Overhead per Unit |
$7 |
Variable/Semi-variable |
Allocated per unit |
|
Total Variable Cost |
$30 |
- |
Per-unit floor |
Tracking Actual Costs vs. Estimates
Estimates provide baseline expectations. Tracking actual costs against estimates throughout development reveals variances early when corrective action remains possible.
Resource management software enables real-time cost tracking, comparing budgeted amounts to actual expenditures as they occur. Visibility helps project managers make informed decisions about scope, timeline, or resource adjustments.
Variance analysis investigates why actual costs differ from estimates. The goal isn't blame assignment but learning—understanding whether variances stem from poor estimation, scope changes, or unforeseen complications.
Earned Value Management
Earned value analysis compares work completed to budget spent, revealing whether projects are on track financially. Projects can be under budget but behind schedule, or on schedule but over budget.
The technique provides objective metrics about project health rather than relying on subjective progress assessments. Cost performance index and schedule performance index quantify exactly how much variance exists.
Industry-Specific Considerations
Cost estimation approaches vary across industries based on product characteristics, development processes, and cost structures.
Software Product Development
Software projects emphasize labor costs over materials. Developer hours dominate budgets, with additional costs for infrastructure, testing, and deployment.
Agile methodologies complicate estimation because detailed requirements emerge iteratively. Story point estimation and velocity tracking provide alternatives to traditional hour-based approaches.
Hardware Product Development
Hardware products balance design labor, prototyping costs, tooling expenses, and material costs. Physical constraints and manufacturing realities drive more sequential development compared to software's iterative nature.
Prototype costs represent significant budget portions, with multiple fidelity levels needed throughout development. Mock prototypes, mechanical prototypes, and production-ready prototypes each serve different validation purposes at different price points.
Consumer Goods
Consumer products often require packaging design, regulatory compliance, and marketing material development beyond core product costs. These ancillary expenses sometimes equal or exceed product development costs themselves.
Retail pricing pressure creates tight margin constraints. Cost estimates must hit specific targets to enable competitive pricing while maintaining profitability.
Frequently Asked Questions
How accurate should product development cost estimates be?
Accuracy expectations depend on project stage. Rough order of magnitude estimates early in concept development might carry ±50% variance. Detailed estimates during design phases should achieve ±10-15% accuracy. The key is matching estimate precision to available information rather than creating false precision with insufficient data.
What percentage should be added for contingency in product development?
Many teams add 5 to 15 percent as contingency depending on project uncertainty. Low-risk projects with proven technology and clear requirements justify lower contingencies around 5%. High-risk innovation projects with unproven concepts should budget 15% or higher. Document the rationale for contingency levels so stakeholders understand the basis.
Should estimates include profit margin or just costs?
Internal estimates for resource planning focus on costs alone. Customer-facing quotes and proposals add profit margin on top of costs. Separating cost from margin provides transparency about actual project expenses versus pricing strategy. For selling price calculations, apply margin percentage after determining total costs.
How do you estimate costs for completely new products without historical data?
Analogous estimation uses similar projects as reference points, adjusting for known differences. Parametric models apply industry benchmarks and unit costs to project parameters. Expert judgment from experienced developers provides initial ballparks. Three-point estimation with optimistic, likely, and pessimistic scenarios bounds uncertainty. The first project establishes baseline data for improved future estimates.
What's the difference between budget and cost estimate?
Cost estimates predict expected expenses based on defined scope and assumptions. Budgets establish authorized spending limits that include estimates plus contingency reserves. The budget might exceed the estimate to provide buffer for uncertainty. Estimates answer "how much will this cost?" while budgets answer "how much can we spend?"
How often should cost estimates be updated during development?
Update estimates whenever significant scope changes occur or when actual costs reveal estimation errors. Monthly reviews work well for projects lasting several months. The goal is maintaining current visibility into expected final costs rather than locking estimates at project start and ignoring reality. Regular updates enable proactive budget management instead of reactive crisis response.
Can cost estimation software replace expert judgment?
Software improves calculation accuracy, consistency, and tracking but doesn't replace domain expertise. Tools apply formulas and aggregate data, but experts provide the assumptions, resource requirements, and risk assessments that drive those calculations. The best results come from combining software efficiency with human judgment about project specifics.
Conclusion
Product development cost estimation blends analytical rigor with practical judgment. No method predicts costs perfectly, but systematic approaches produce actionable forecasts that enable informed decisions.
The core principles remain consistent across industries: break work into components, quantify resource requirements, apply current rates, and add appropriate reserves for uncertainty. Execution details vary based on product type, development stage, and available historical data.
Accurate estimates don't just prevent budget overruns. They enable strategic resource allocation, realistic pricing, and confident go/no-go decisions about which products to develop.
Start with clear scope definition. Choose estimation methods that match available information. Account for both direct and indirect costs. Build contingency reserves proportional to risk. Track actuals against estimates to enable course corrections and improve future forecasting.
The investment in thorough cost estimation pays dividends throughout the product lifecycle. Teams that understand true development costs make better tradeoff decisions, set realistic stakeholder expectations, and deliver profitable products that justify the investment required to create them.
Ready to improve cost estimation accuracy? Begin by documenting current estimation processes, capturing actual cost data from completed projects, and establishing organizational standards for estimation methods and contingency levels. Build the foundation now that enables better forecasts tomorrow.


